


A qEEG screening tool to quantify the many aspects of the state of the brain and mind
![]()
Based on years of experience and numerous scientific empirical studies in cognitive neuroscience, BrainMind Audit® – an innovative, scientifically based qEEG-screening tool, was developed to assist in objectively quantifying some aspects of the brain and mind status.
Collectively, capitalizing on theoretical and methodological conceptualizations, description of mental and brain processes is grounded on scientific evidence of a clear relationship between specific qEEG markers and personality traits, as well as cognitive processes.
A key feature of personality traits is their relative temporal stability over longer periods of an individual’s lifespan. An individual with a certain trait characteristic responds similarly to many instances of stimulus presentation or situations over a period of several months or years. The neural counterpart of a personality trait is reflected in intrinsic properties of brain activity measured by resting qEEG.
The BrainMind Audit® is based on mathematical and statistical processing of digital qEEG, which condenses the qEEG data to a single-page color-coded summary – the BrainMind Audit® Profile (Fig. 1, Table 1). The BrainMind Audit® Profile provides an integrated result of multiple indices related to brain and mind functioning that are derived from qEEG data from a 19-channel EEG-recording with a standard International 10-20 electrode placement system. EEG assessment and extraction of qEEG characteristics needed for calculation of BrainMind Audit® metrics are done in accordance with recommendations of the International Federation of Clinical Neurophysiology (IFCN), the American Medical Electroencephalographic Association, and the American Psychiatric Electrophysiological Association for the clinical utility of qEEG in neurological and psychiatric disorders.
BrainMind Audit® is centered around dimensional psychological constructs (or concepts) that are relevant to human personality, behaviour and mental conditions. According to this dimensional approach, the expression of individual features is continuously distributed in the general population from “healthy expressed” to “disordered”. BrainMind Audit® Profile assumes this dimensional nature of psycho-physiological constructs (see Fig. 1). This profile maps specific psycho-physiological constructs based on the best available knowledge about mental and brain mechanisms. According to it, on a functional level, there is a continuous non-linear relationship between the possible ranges of a neural expression and an associated mental feature.
Individual features (constructs) are grouped into higher-level domains of human behavior and functioning that reflect contemporary knowledge about major systems of tonic vigilance (arousal), emotion (positive valence vs negative valence), motivation (approach vs withdrawal), cognition (attentional control and information processing speed), anxiety (somatic vs apprehension), social behavior (excitement (in)tolerability) and resilience (stress resistance and brain resources).
The BrainMind Audit® Profile consists of 9 evaluation metrics that provide easy-to-understand quantitative values for otherwise complicated neuro-psycho-physiological constructs or concepts (Fig. 1, Table 1).
![]()
Figure 1. BrainMind Audit® Profile.
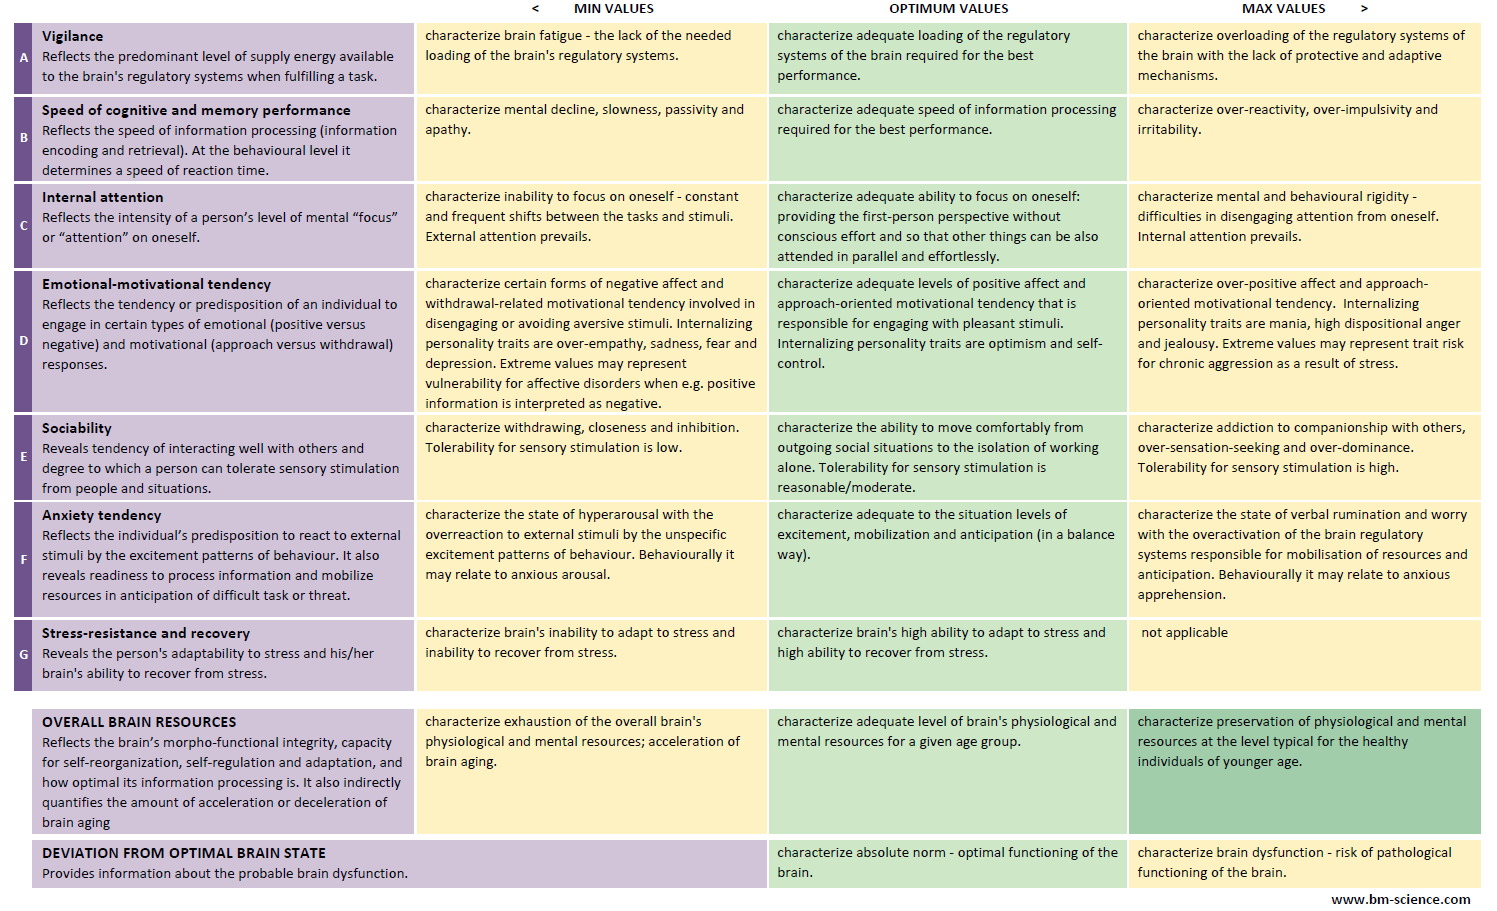
Table 1. Metrics’ description.
What does BrainMind Audit® Profile give and how it can help?
In a wider context, the BrainMind Audit® offers a biological basis for personality traits.
In a practical context, the BrainMind Audit® Profile allows one to benefit from learning personal insights about the brain and mind through qEEG. By using the BrainMind Audit® profile individual/trainer/coach will:
- better understand the status of baseline (trait) characteristics of the customer’s brain and mind activity,
- establish the customer’s own control state in measuring the efficacy of personalized coaching/training and outcomes,
- get an objective "before and after" evaluation of long-term coaching/training efficacy,
- get the possibility to adjust coaching/training to the needs of the customer’s brain and mind.
The benefits of using BrainMind Audit® Profile in training were demonstrated in a proof-of-concept study (results were presented at the international conference “Towards the Science of Consciousness” held at the University of Helsinki, Finland 2015). This study demonstrated that when training is adjusted based on the BrainMind Audit® Profile:
- up to 75% of metrics had improved (vs. 65% of metrics for non-adjusted training),
- individuals gained 35% of metrics that reached the optimal range (vs. 10% of metrics for non-adjusted training),
- up to 65% of individuals have improved,
- the number of individuals that had metrics within the optimal range after training increased by 22% (vs. 7% for non-adjusted training).
The confirmation study was published in the peer-reviewed Journal of Physiology.
The practical utilization of BrainMind Audit® screening to optimise senior-level managers' individualised coaching in real-world conditions revealed significant improvement (71%) or optimization (56%) of metrics in the 72% of senior executives. This was paralleled by reduced anxiety and depressed mood scores measured by the independent psychometric inventories. The study results were published in the peer-reviewed journal Coaching.
Overview of the metrics’ scale: optimal range and deviation from it
The optimal range of qEEG characteristics represents certain ideal characteristics displayed by the majority of healthy subjects in the same age group without current or past neurologic or mental health complaints, family history of neurologic and psychiatric diseases, or other illnesses or traumas that might be associated with brain dysfunction. It is assumed that the optimal range of qEEG characteristics is a zone in which an individual has a higher probability of achieving an optimal performance than a nonoptimal performance. Optimal performance ensures efficient recruitment of resources in the mobilization of energy and utilization of skill for favorable task engagement.
In this context optimal performance include:
- successful performance
- maximum efficiency
- minimal cost
- temporal adequacy
Optimality here is understood in terms of a tradeoff that balances the accuracy or benefit (result) of the performance against an appropriate cost (the time, energy, memory, and computational resources).
There is abundant scientific evidence that normative qEEG values are the result of brain electrical rhythms' autoregulation by a complex homeostatic brain system that is independent of ethnic or cultural factors. Thus, qEEG could be used in any culture.
Since there are neurophysiological limits as to how high or low qEEG characteristics are able to “go”, only the optimal range offers equally enough “space” for increase or decrease (deviation to both sides away from the optimal range) dependently on the task/environment condition, thus being adaptive.
Between optimality and disfunction there is a spectrum of conditions associated with varying kinds and degrees of functionality. Healthiness and diseases can be conceptualized non-categorically, as a heterogeneity of phenotypes that exist along a continuum between optimality and disfunction.
Deviation from the optimal range does not necessarily reflect gross abnormality or a pathologic process. Deviation means that the brain functions less efficiently, thus spending more energy and resources to achieve a given task or operation (Fig. 2). Additionally, deviation limits the range of emotional and behavioural characteristics that are accessible to the individual.
In relation to performance, people with “deviated” metrics can achieve the same performance level as people with metrics in the optimal range; however, they will pay a higher psychophysiological price for the same result (Fig. 2).
If the compensatory mechanisms of the brain are intact, then a small deviation is unlikely to be pathologically significant and lies within the normative range of individual variability. However, the pathogenic significance of qEEG deviations from the optimal range increases when compensatory mechanisms of the brain are exhausted. This is usually associated with strong and very strong deviations from the optimal level.
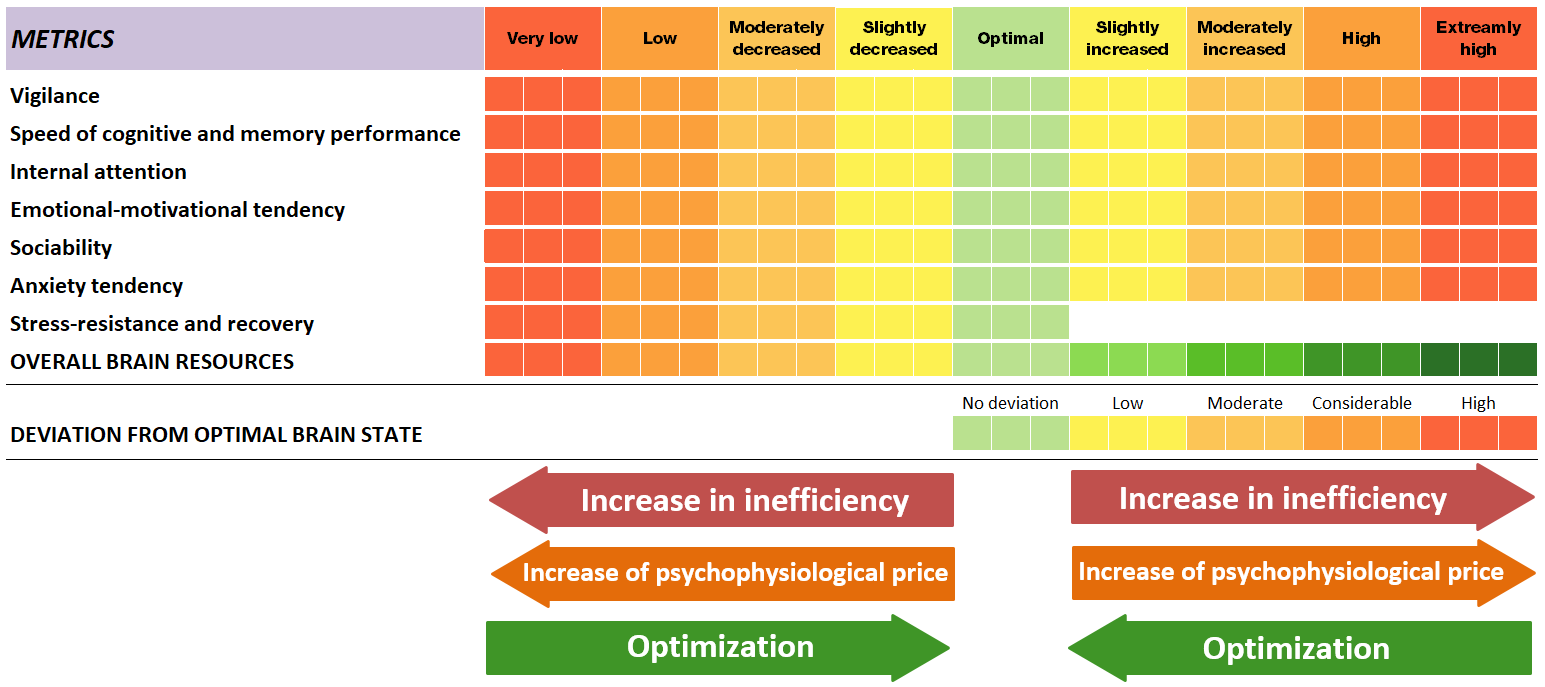
Figure 2. Meaning of the deviation from the optimal range. Exception is the right side of the “Overall brain resources” metric: inefficiency and price decrease and optimization increases to the right direction.
From an information-processing point of view, neuro-cognitive capacities vary in the human population from extremely efficient to extremely inefficient, depending on the underlying genetic composition, trait predispositions, learning history, life events and style, and state variables. This variation is often normally distributed.
Since neuro-cognitive processes form and shape individual behaviors, suboptimal neuro-cognitive capacity can translate into behavioral symptoms. The frequency and intensity of these symptoms are continuously distributed in the general population — with most being below (or above) the threshold for clinical significance. However, normal function becomes impaired when symptoms escalate, making it difficult to maintain normal relationships and occupational productivity.
Here, the focus lies in measuring the expression of a neural mechanism over a continuous range. A corresponding mental feature that is linked to the said neural mechanism would also show a range of expression. Importantly, “functionality” is the degree to which the individual is able to function given various degrees of expression of the given mental feature. Hence, the degree of functionality associated with the expression of the mental feature corresponds to the degree of the neural measure. The expression of the neural mechanism in the middle range (marked as green) is expected to lead to an expression of the mental feature in a manner that is optimal for mental order or functioning. Expression of the neural measure outside the optimal range is expected to be associated with changes in the functionality of the mental feature that is “normal” but falls in a sub-optimal zone (from yellow to red), representing a state of increased risk for mental disfunction or disorder. Inefficient functioning zones (dark orange) on either end of the spectrum of the “normal” range can be seen as a transition zone towards a probable pathological state of manifestation of mental features. Further extremes in the neural measure (red area) are associated with an expression of the mental feature that is dysfunctional and may occur in a “pathological state” as it leads to impairments in behavior. Extremes are always maladaptive.
Indeed, studies on healthy people showed that extreme neural values, even in otherwise normal individuals, impair their functionality, while middle values favor optimum functioning.
Important: the “movement” of metrics’ scores toward the optimal range as a result of training and intervention programs signifies optimization in brain and mind activity (Fig. 2).
Brief overview of the metrics
- VIGILANCE metric → predominant baseline "POWER SUPPLY" level
- SPEED OF COGNITIVE AND MEMORY PERFORMANCE metric → SPEED OF THE BRAIN’s “ENGINE”
- INTERNAL ATTENTION metric → SELF-FOCUS
- EMOTIONAL-MOTIVATIONAL TENDENCY metric → predominant AFFECT & FIGHT-or-FLIGHT responses
- SOCIABILITY metric → SENSORY STIMULATION & EXCITEMENT TOLERABILITY
- ANXIETY TENDENCY metric → tendency of “BEING ON GUARD” across a variety of situations
- STRESS-RESISTANCE AND RECOVERY metric → ADAPTABILITY & RESILENCE
- OVERALL BRAIN RESOURCES metric → “BIOCAPITAL”
- DEVIATION FROM OPTIMAL BRAIN STATE metric → LIKELIHOOD OF NEURO-DYSFUNCTION
Note: BrainMind Audit® has been developed for adults and should not be applied to the EEG of children or adolescents under the age of 20 years old.
What is the scientific basis, validity and reliability for BrainMind Audit® Profile?
Numerous scientific studies have demonstrated that neurometric qEEG has excellent test–retest replicability within an individual and has been demonstrated to have high specificity as well as sensitivity to a wide variety of cognitive processes, as well as developmental, neurologic, and psychiatric conditions. These findings have been validated through multiple publications in top-tier peer-reviewed scientific journals.
In order to select qEEG candidates for BrainMind Audit® Profile metrics, 1169 EEG-papers published in professional scientific peer-reviewed journals were reviewed and systematically analyzed.
Analysis of the EEG studies revealed that certain qEEG characteristics are functionally related to brain maturation, aging, personality features, various types of cognitive capacities, performance, and psycho-neuropathology.
While constructing BrainMind Audit® Profile metrics, only those qEEG characteristics were taken into consideration that demonstrated high heritability, stability, as well as reliable and valid (consistent) association with particular cognitive/psychological processes in a number of studies with converging results during (a) rest in healthy and pathological conditions, and (b) instrumentally or pharmacologically induced conditions, as well as (c) in maturational and ageing studies.
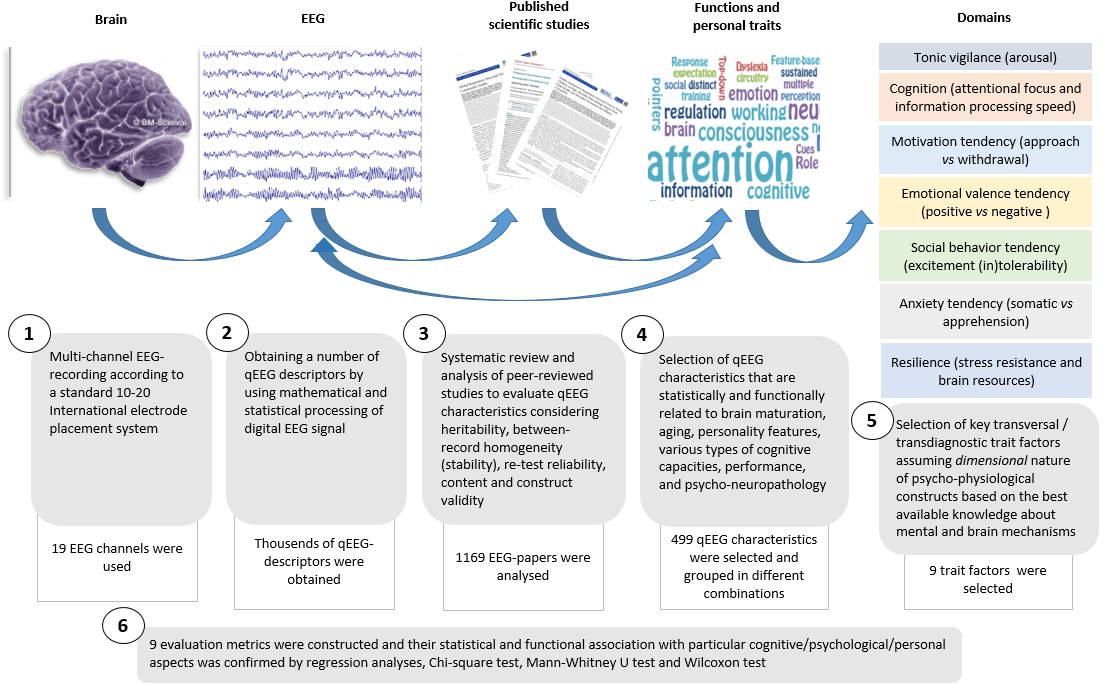
As a result, 499 qEEG characteristics were selected. They were grouped into different combinations to form the 9 BrainMind Audit® Profile metrics.
In order to evaluate the association of constructed BrainMind Audit® Profile metrics with particular cognitive/psychological processes/functions, they were submitted to regression analyses. Regression analyses revealed a high association of BrainMind Audit® Profile metrics with particular cognitive/psychological processes: statistical significance values were in the range p < 0.05 – p < 0.00004 (for different metrics).